Where the time actually goes in an AI agent's sandbox
If you run a coding agent in production, you have a sandbox somewhere, and at some point someone will ask you three questions about it. How much of each agent step does it eat? How many steps per second can one box handle? And what happens to both numbers if you swap the container for something stronger?
I measured all three on the same substrate, the same image, and the same command, so the answers can be compared with each other. Some of them were not what I expected, and one of them will change how you size hardware.
Where an agent step goes
I pointed a code-generation loop at the first twenty tasks of the official HumanEval release, three times over, sixty task executions in all. For each task the model gets the signature and docstring and returns the function. The sandbox runs the prompt, the completion and the task's published check in a fresh container, and the exit status decides. A deliberately wrong candidate exits with an AssertionError, which is the control that proves the exit codes are real.
Sixty of sixty passed. The pass rate measures the model, not the sandbox, and I only report it so nobody asks. What I care about is the clock.
| Component | Median per task | Share of wall-clock |
|---|---|---|
| Model call (claude-opus-5, adaptive thinking) | 3.42 s | 85 percent |
| Sandbox create, exec, destroy | 453 ms | 15 percent |
| End to end | 3.95 s |
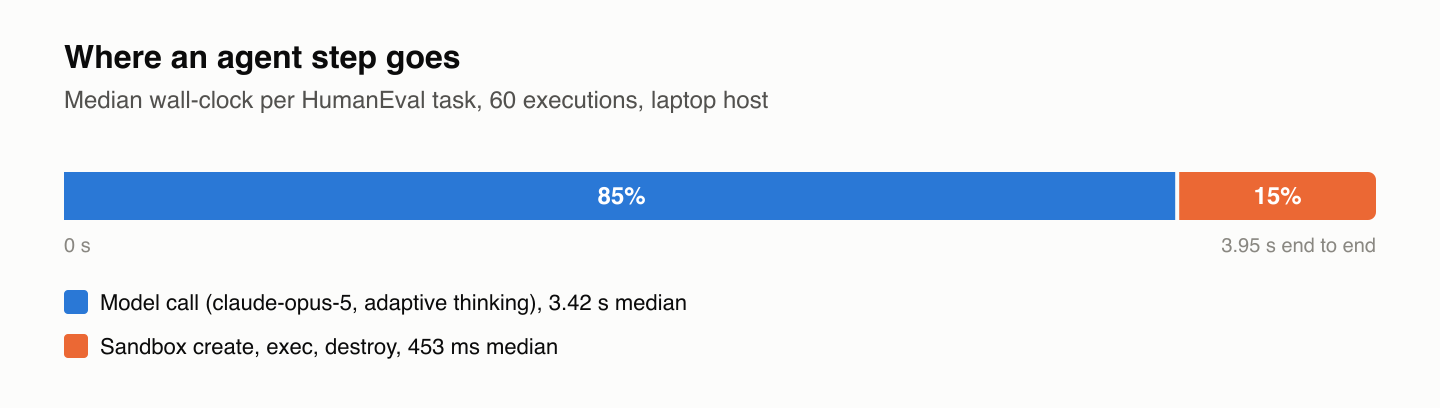
That has a practical consequence. Shaving 50 ms off sandbox creation buys you about one percent of an agent step. Shaving 50 ms off anything in the model path buys the same. Neither is nothing, but if your sandbox is already in the low hundreds of milliseconds, further tuning is a rounding error against inference. Spend the engineering somewhere else.
The exception is if your sandbox is not in the low hundreds of milliseconds, which brings me to the runtimes.
What the control plane itself costs
Before the runtime question, one clarification, because I want to be precise about what is being measured.
My substrate is a Go control plane over the Docker Engine API and a small Rust agent inside the container that streams stdout, stderr and produced files back over JSON-RPC. Against raw Docker with the identical hardened configuration on the same host, that layer costs 25 ms per lifecycle: 22 ms on create, 2 ms on the first exec, 1 ms on destroy. Sixteen percent of a raw lifecycle. An idle sandbox holds 0.43 MiB of working set and 0.01 percent of a CPU.
That 25 ms buys an HTTP API any language can call, streamed output and artifacts as events, and a create that takes one round trip. An operator who already drives the Engine API from Go and does not need streaming would not pay it. I say so because the rest of this article is about the boundary underneath, and I do not want the substrate's cost confused with the boundary's.
Throughput on one host, and what caps it
I swept client concurrency from one to thirty-two, eighty create-destroy lifecycles per level, and repeated the entire sweep ten times.
On the laptop, throughput rises from 7.0 sandboxes per second at one client to a plateau of 17.2 at sixteen clients, and 17.1 at thirty-two. The last three levels sit inside one another's confidence intervals. On a four-vCPU native Linux host the plateau is 12.3 at eight clients.
One thing about that sweep before the numbers: a single pass at four or eight clients can land anywhere in a two-to-one band. A throughput curve drawn from one sweep per level, which is how such curves are usually drawn, is mostly noise. Ten sweeps and a confidence interval are the minimum for the shape to mean anything.
So what is the plateau? Either four cores or one Docker daemon. To tell them apart I repeated the ten sweeps on eight- and sixteen-vCPU hosts of the same family, same image, same harness.
| Host | Peak sandboxes per second | Single-client rate |
|---|---|---|
| 4 vCPU | 12.3 | 3.8 |
| 8 vCPU | 13.6 | 4.3 |
| 16 vCPU | 15.2 | 4.4 |
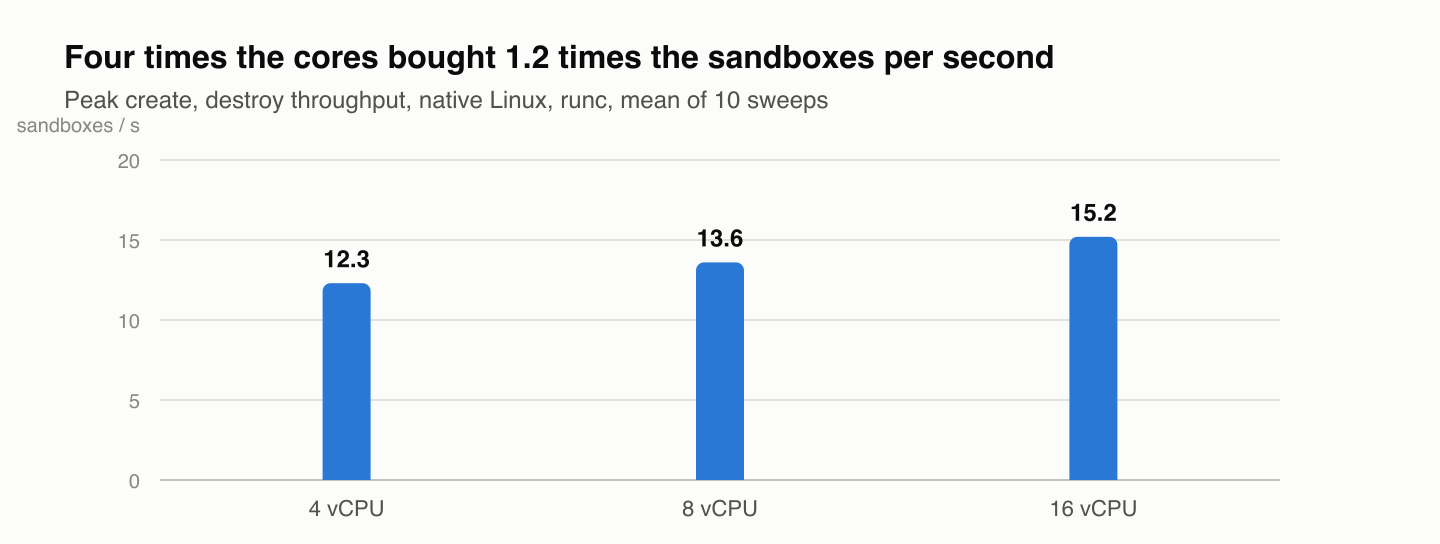
Container churn on one host is bounded by the daemon's serialization of create and destroy, and adding cores does not change that. If you need more sandboxes per second, you need more daemons, which means more hosts. Buying a bigger box for this workload is close to buying nothing. That is the sizing result I would want someone to have told me a year ago.
Swapping the boundary
Docker accepts an alternative OCI runtime per container. Nothing else in the stack changes. I ran the same control plane, agent, image and harness under runc, under gVisor's runsc, and under Kata Containers, which boots a QEMU microVM per sandbox, on one host with nested virtualization.
| Runtime | Lifecycle median | Substrate cost | Substrate share | Peak throughput |
|---|---|---|---|---|
| runc | 354 ms | 50 ms | 14 percent | 12.5 per second |
| gVisor | 405 ms | 64 ms | 16 percent | 9.5 per second |
| Kata | 7,824 ms | 75 ms | 1 percent | 0.5 per second |
Two things to read off that table.
First, the substrate cost is close to a constant. Fifty, sixty-four, seventy-five milliseconds. It does not scale with the boundary. So it is 14 percent of a container lifecycle and one percent of a microVM lifecycle. Most of a lifecycle is the boundary itself, and the control plane and agent add a small fixed amount on top. That is what an interface designed for swappable backends is supposed to look like when you measure it.
Second, Kata is twenty-two times slower than runc, and at that price it also failed to create 23 of 72 sandboxes once concurrency reached sixteen, where the other two runtimes had no errors at all. Under a microVM, a fresh sandbox per agent step is a different proposition.
The two flags that tripled the microVM
Here is the part I did not see coming.
Kata's stock lifecycle on this host is about 2.8 seconds. Its lifecycle with my hardened configuration is 7.75 seconds. The hardening, which was free under runc, cost five seconds under a microVM. I isolated the flags one at a time, three runs each.
| Configuration | Kata lifecycle |
|---|---|
| Bare Kata boot, stock | 2.8 s |
plus network none |
7.7 s |
| plus one-CPU quota | 10.7 s |
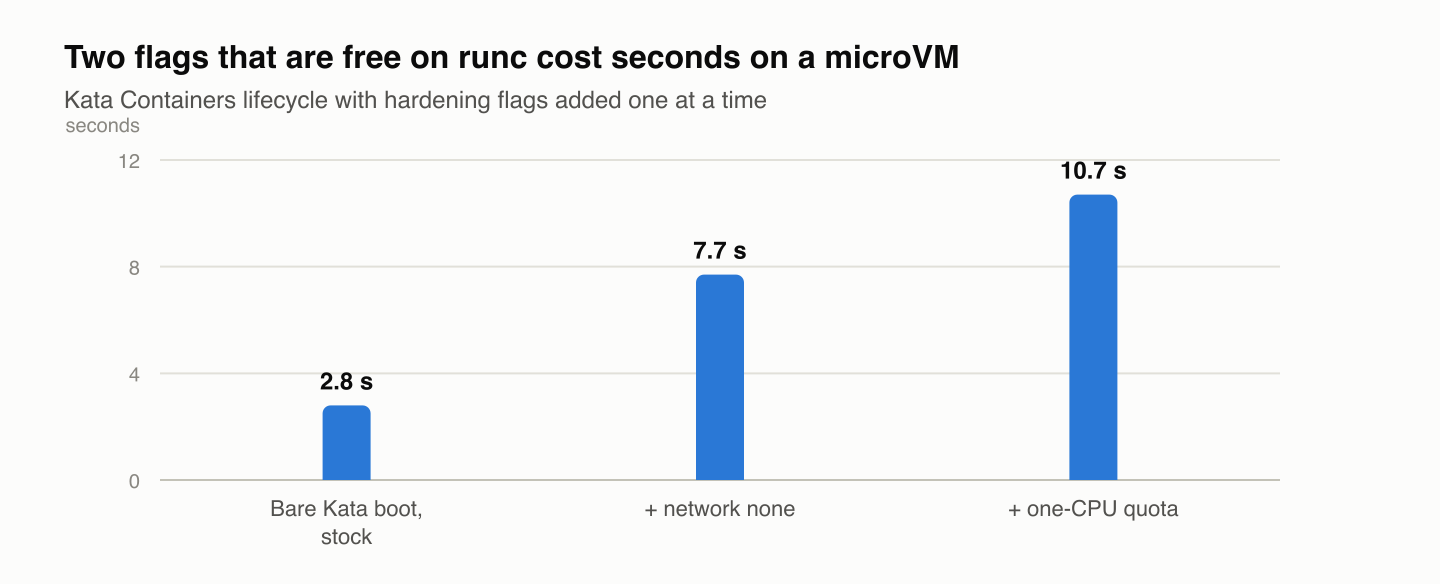
Two settings that are free, or better than free, under runc cost seconds under a microVM. So the driver grew two runtime-aware settings. One is an operator-created Docker network that the driver verifies is internal with inter-container traffic disabled, used instead of none, so the sandbox still cannot reach anything but the bridge is already there. The other drops the CPU quota while keeping the memory and PID limits.
With both, the Kata lifecycle falls from 7,824 ms to 2,856 ms, 8.1 times runc rather than 22, and throughput rises from 0.5 to 1.2 sandboxes per second. The escape probe still denies twelve of twelve, both egress vectors included. The security posture did not move. The boot time did.
The general lesson: a hardening flag is a request to the runtime, and different runtimes pay for the same request in different currency. A configuration tuned on containers is not a configuration tuned on microVMs, and the only way to know which flags travel is to measure them under the second runtime.
What this means for sizing
Putting the pieces together, for an agent doing a fresh sandbox per step:
Under runc, a lifecycle is a few hundred milliseconds and about 15 percent of an agent step with a frontier model. One four-core host sustains around twelve sandboxes per second, and cores beyond four buy almost nothing. Scale horizontally.
Under gVisor, add roughly 15 percent to the lifecycle and lose about a quarter of peak throughput. The sizing does not otherwise change.
Under Kata, with the runtime-aware settings, a lifecycle is around three seconds, comparable to the model call itself, and one host sustains about one sandbox per second. A fresh microVM per agent step is affordable for low-volume, high-assurance work and not otherwise. Reusing a warmed sandbox across compatible steps would spread that cost, the way serverless platforms cache paused containers, and the interface already lets create return an existing identifier. What reuse costs in isolation has to be measured first, and I have not measured it.
And under any of them, if the question is "how do I get more sandboxes per second," the answer is more daemons, not more cores.
Where the numbers come from
Everything here was measured on the same open-source substrate with the same harness: a MacBook Pro M1 Pro running Docker in a four-vCPU colima VM for the laptop figures, and Compute Engine n2-standard-4, -8 and -16 instances for the native and scaling figures. Five runs of 200 lifecycles for the latency numbers, ten sweeps per concurrency level for throughput, three repetitions of the agent trace, with the host load recorded next to every trace. The substrate, harness, campaign runner and raw traces are MIT-licensed.
Repository: https://github.com/akshayaggarwal99/boxed Numbers in this article: https://github.com/akshayaggarwal99/boxed/tree/v0.3.2-paper